A dashboard is a question, not a collage
Beginner Power BI work fails when every chart is included. Each example below answers one question a manager might ask on a Monday morning.
Five starter dashboards
Build one of these before you add custom visuals.
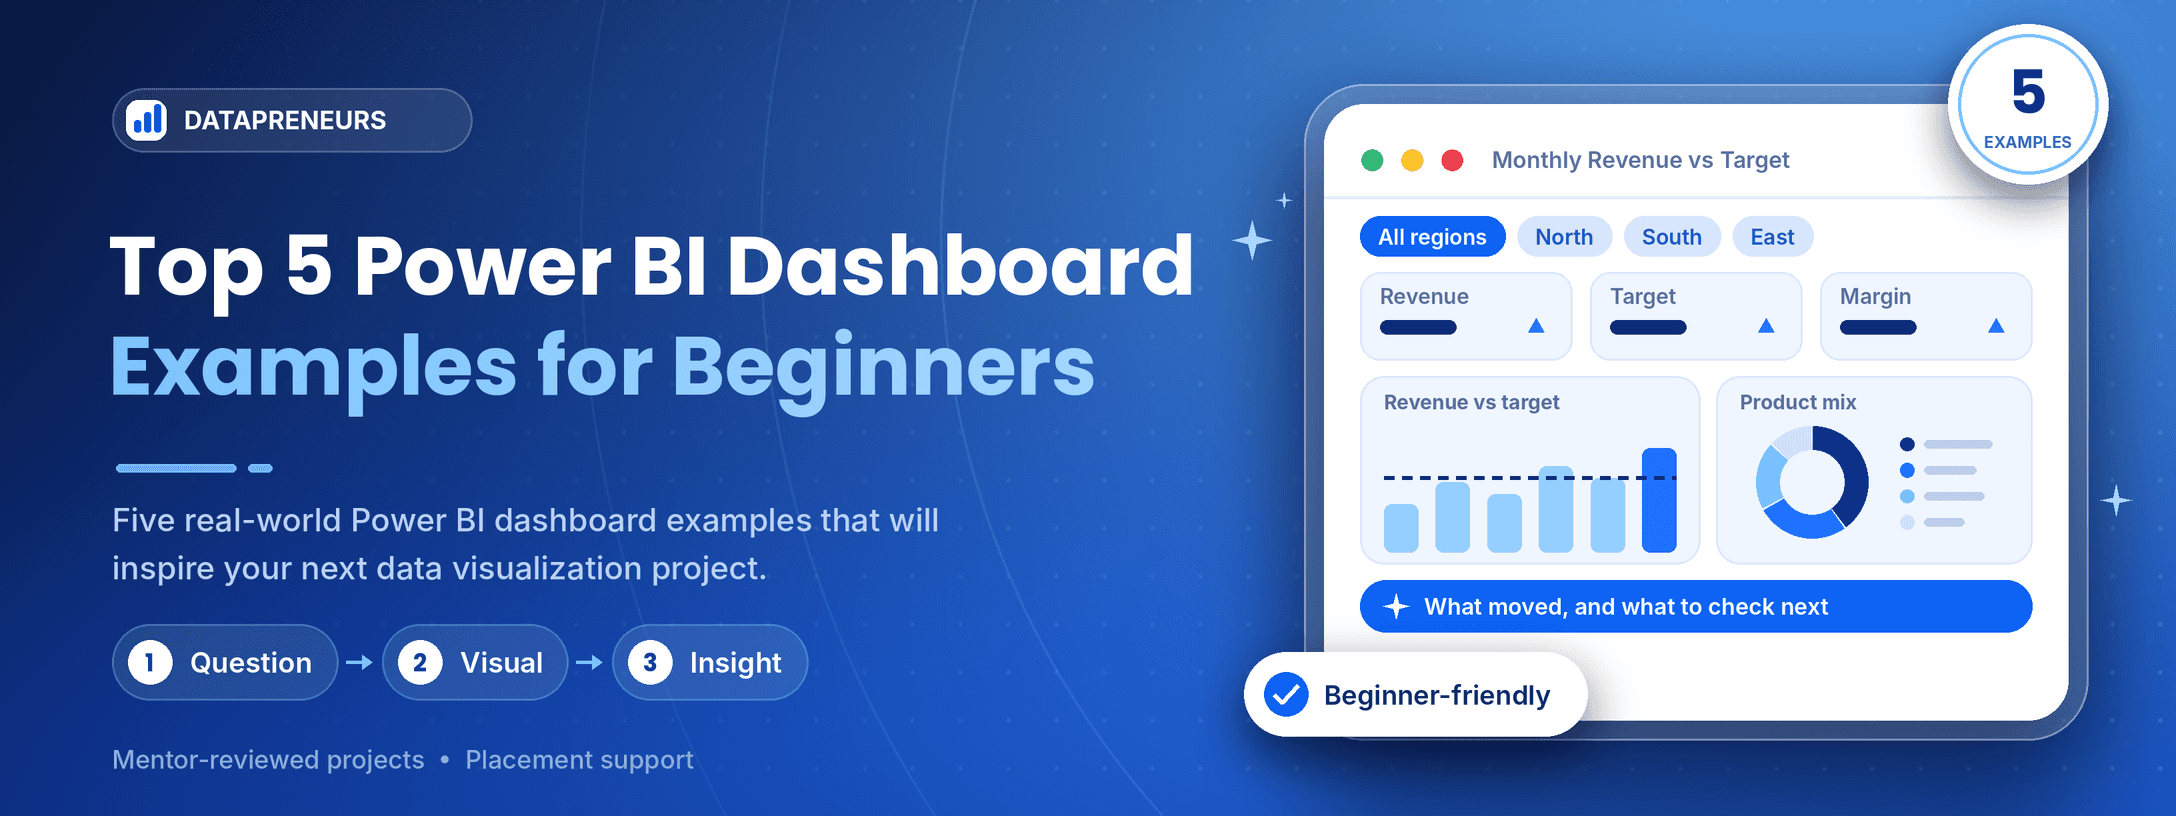
- Monthly revenue versus target, with a region slicer.
- Product mix: which SKUs drive margin, not only volume.
- Support tickets by category and ageing.
- Marketing funnel from visit to paid order.
- A single KPI page with the previous period beside the current one.
What to write under the visual
Add one sentence: what moved, and what you would check next. That sentence is what the Business Analytics Course treats as the deliverable, alongside the Power BI file.